Mass spectrometry is often summarized as an identity test, but that shorthand hides the reasoning that turns a signal into a bounded conclusion. The instrument records ion response at one or more m/z values. An analyst must still connect those observations to the submitted sample, assign charge and ion species, account for isotopes and adducts, apply calibrated processing, and compare the result with a defined expectation.
This guide explains that chain without presenting a simulated spectrum as evidence. It is written for researchers reviewing method reports, certificates of analysis, or vendor verification language—not for clinical decision-making or administration. For a document-first workflow, pair it with How to Read a Peptide Certificate of Analysis.
- The instrument measures m/z, not a product label. Sample traceability and ion assignment remain part of the evidence.
- Charge changes the displayed value. The same neutral species can appear at several m/z values.
- Intact mass supports a narrower claim than MS/MS. A mass match is not complete sequence confirmation.
- Mass accuracy and resolving power are different. Neither has one universal acceptance threshold across instruments and methods.
- MS is not a purity-percentage substitute. Chromatographic profile, identity, sequence, content, and microbiological attributes require claim-matched methods.
What does peptide mass spectrometry actually measure?
A mass spectrometer measures the mass-to-charge ratio of detected ions. A peptide must first become a gas-phase ion, then travel through an analyzer whose behavior depends on m/z, and finally produce a detector response. Reviews by Mann and colleagues and by Aebersold and Mann established this measurement chain as a foundation of modern protein and peptide analysis.12 Both are narrative reviews and report no single quantitative endpoint.
The raw observation is therefore not “this vial contains the intended peptide.” It is closer to “under this acquisition and processing method, the detector recorded ions at these m/z values.” Identity support emerges only after the sample record, expected chemical species, charge-state assignment, adduct assumptions, isotope convention, calibration, deconvolution, and acceptance rule are connected.
Mass spectrometry does not establish purity. Relative ion response is not a chromatographic purity percentage, and an intact-mass match does not quantify every component in the sample.
The six-stage measurement chain
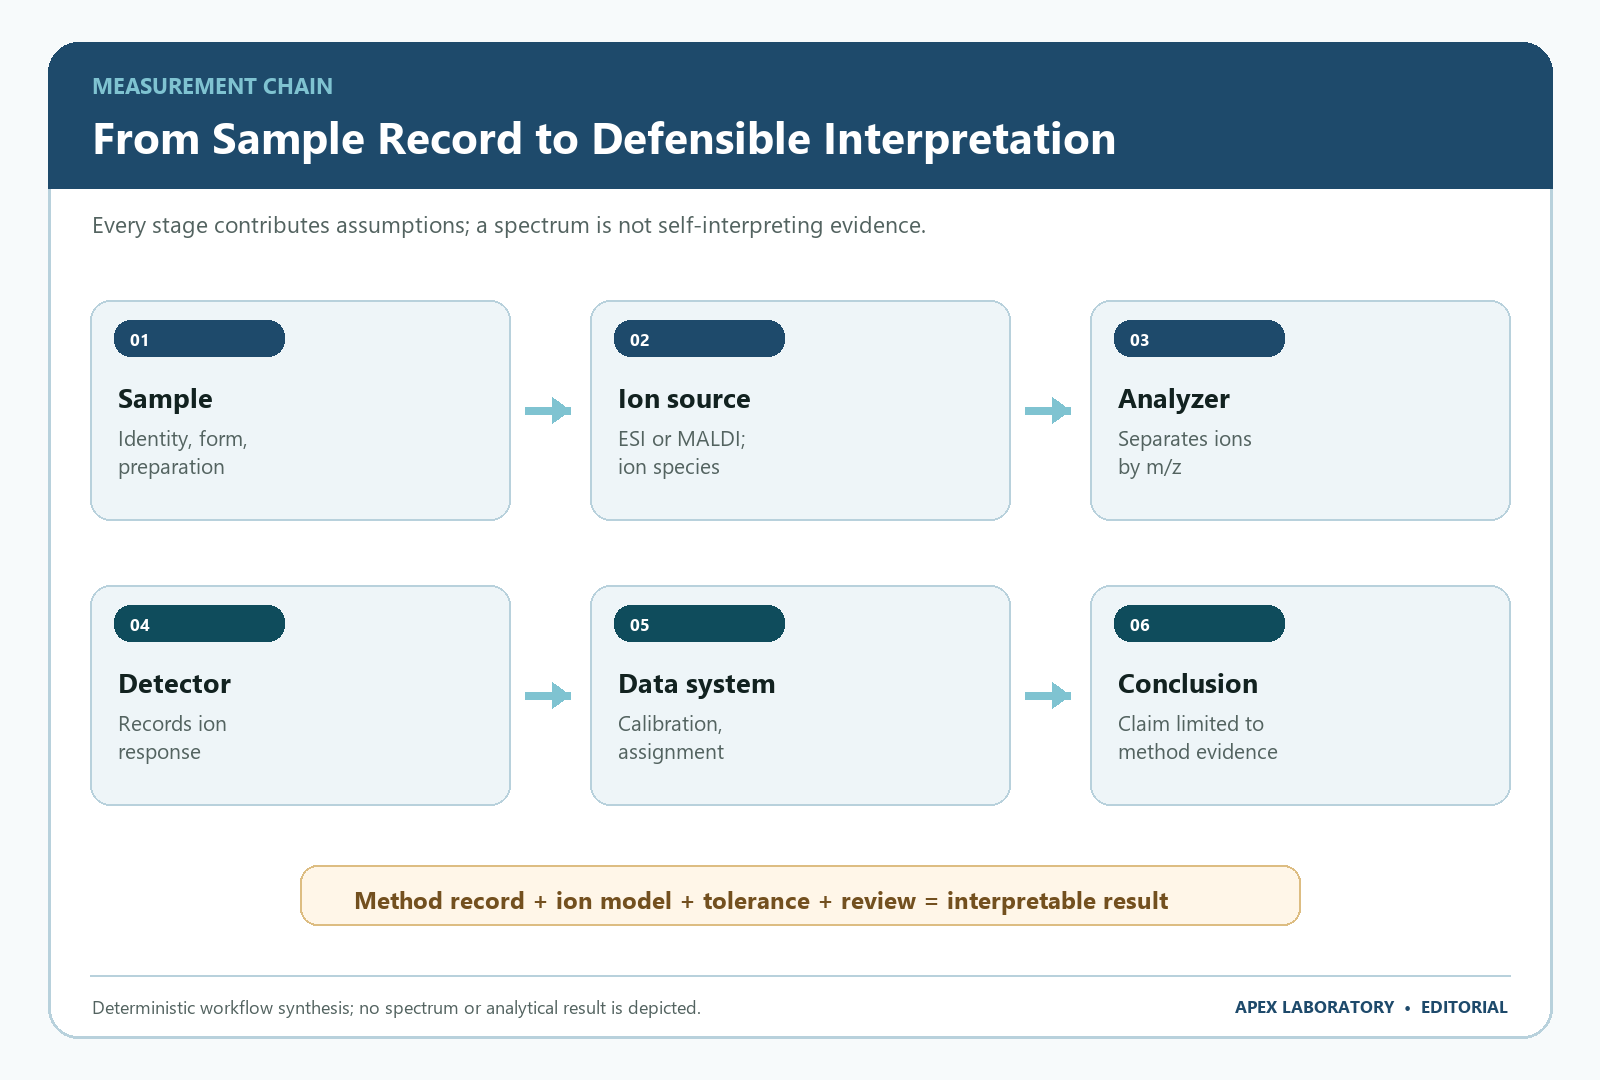
- Sample definition: sequence, termini, modifications, disulfides, counterion or salt form, lot, preparation, and submitted sample identity.
- Ionization: the method creates detectable gas-phase ions, often with multiple charge states or adducts.
- Mass analysis: the analyzer separates or resolves ions according to m/z using its physical measurement principle.
- Detection: ion response is converted to a signal; response intensity is not automatically concentration.
- Processing: calibration, centroiding, isotope selection, charge assignment, adduct assignment, and deconvolution transform observations into reported values.
- Interpretation: an expected species and acceptance rule define what the result can support—and what it cannot.
That sequence explains why a detached peak label is weak evidence. The same printed value can be interpreted differently when the ion species, charge, calibration state, or expected chemical form changes.
How do m/z and charge state relate to molecular mass?
For a positively charged, protonated ion represented as [M+zH]z+, a useful simplified relation is m/z = (M + zH) / z, where M is the neutral molecular mass, z is the charge number, and H is the proton mass used by the calculation. Because the numerator gains z protons and the total is divided by z, one neutral species can appear at several m/z values.
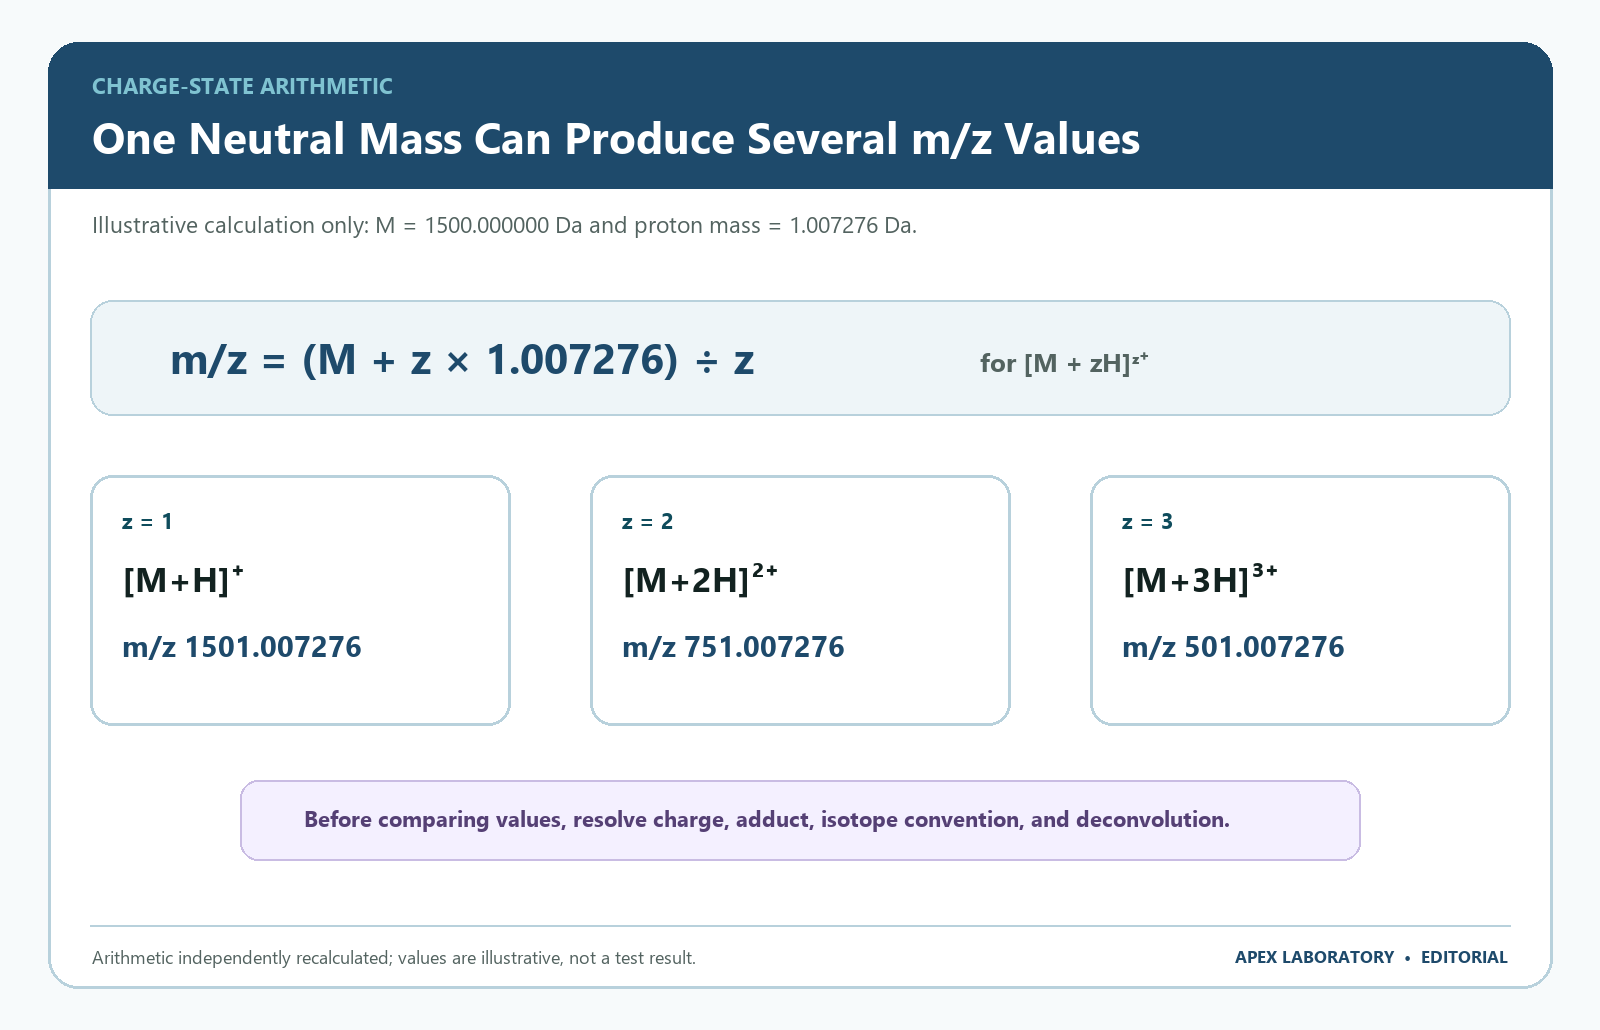
The illustration uses a hypothetical neutral monoisotopic mass of 1500.000000 Da and a proton mass rounded to 1.007276 Da. It does not include sodium or potassium adducts, neutral losses, isotope selection, or instrument-specific processing. Those details belong in the actual method record.
Isotope spacing can support charge assignment because adjacent isotope peaks are separated by approximately 1/z in m/z—about 1.0 Da apart at +1, 0.5 Da at +2, and 0.33 Da at +3. That relationship is useful, but software output still needs review when peaks overlap, the signal is weak, multiple species coexist, or the isotope envelope is unresolved. Steen and Mann’s peptide-sequencing tutorial provides a broader treatment of charge states, fragment ions, and spectrum interpretation.3
ESI and MALDI: two ionization routes
Electrospray ionization
Electrospray ionization, or ESI, transfers ions from solution and commonly produces a distribution of multiply charged species. This makes ESI compatible with liquid-chromatography coupling and places higher-mass molecules inside an analyzer’s accessible m/z range. The method record should identify polarity, source conditions, solvent system, acquisition range, and any LC separation used upstream.
Matrix-assisted laser desorption/ionization
Matrix-assisted laser desorption/ionization, or MALDI, analyzes material co-crystallized with a matrix on a target and often produces predominantly singly charged ions. Matrix choice, spot preparation, laser conditions, background, and calibration influence interpretation. ESI and MALDI are not interchangeable labels: each creates a different ion population and different sources of ambiguity.4 That review is a narrative synthesis and reports no single quantitative endpoint for either ionization route.
Neither ionization route guarantees that every component has equal response. Ionization efficiency depends on chemical properties, matrix, co-eluting species, suppression, instrument settings, and concentration. That is why relative MS peak intensity should not be converted into a purity percentage without a validated quantitative method.
Mass analyzers, resolving power, and mass accuracy
Quadrupole, time-of-flight, Orbitrap, and hybrid systems separate or measure ions through different physical principles. Hybrid configurations can select a precursor in one stage and analyze product ions in another. Domon and Aebersold review these instrument classes in the context of peptide and protein analysis.5 That survey is also narrative and reports no single quantitative endpoint of its own.
Resolving power describes the ability to distinguish ions close in m/z. Mass accuracy describes agreement between an observed value and an accepted reference or expected value under a specified calculation. A high-resolution instrument can still produce a biased result if calibration, peak assignment, or processing is wrong. Conversely, a lower-resolution method may be fit for a defined screening question when its performance and acceptance rule are validated.
Orbitrap instruments detect image current from trapped-ion oscillation and use a Fourier transform to obtain m/z information. The original ESI–Orbitrap interface paper by Hardman and Makarov reported resolving power up to 150,000 FWHM, mass accuracy within a few parts per million, and a relative mass range up to 8-fold on that 2003 prototype coupling; those figures describe that instrument configuration and are not a universal specification for every later platform or method.6
Intact mass versus tandem mass spectrometry
What intact mass can support
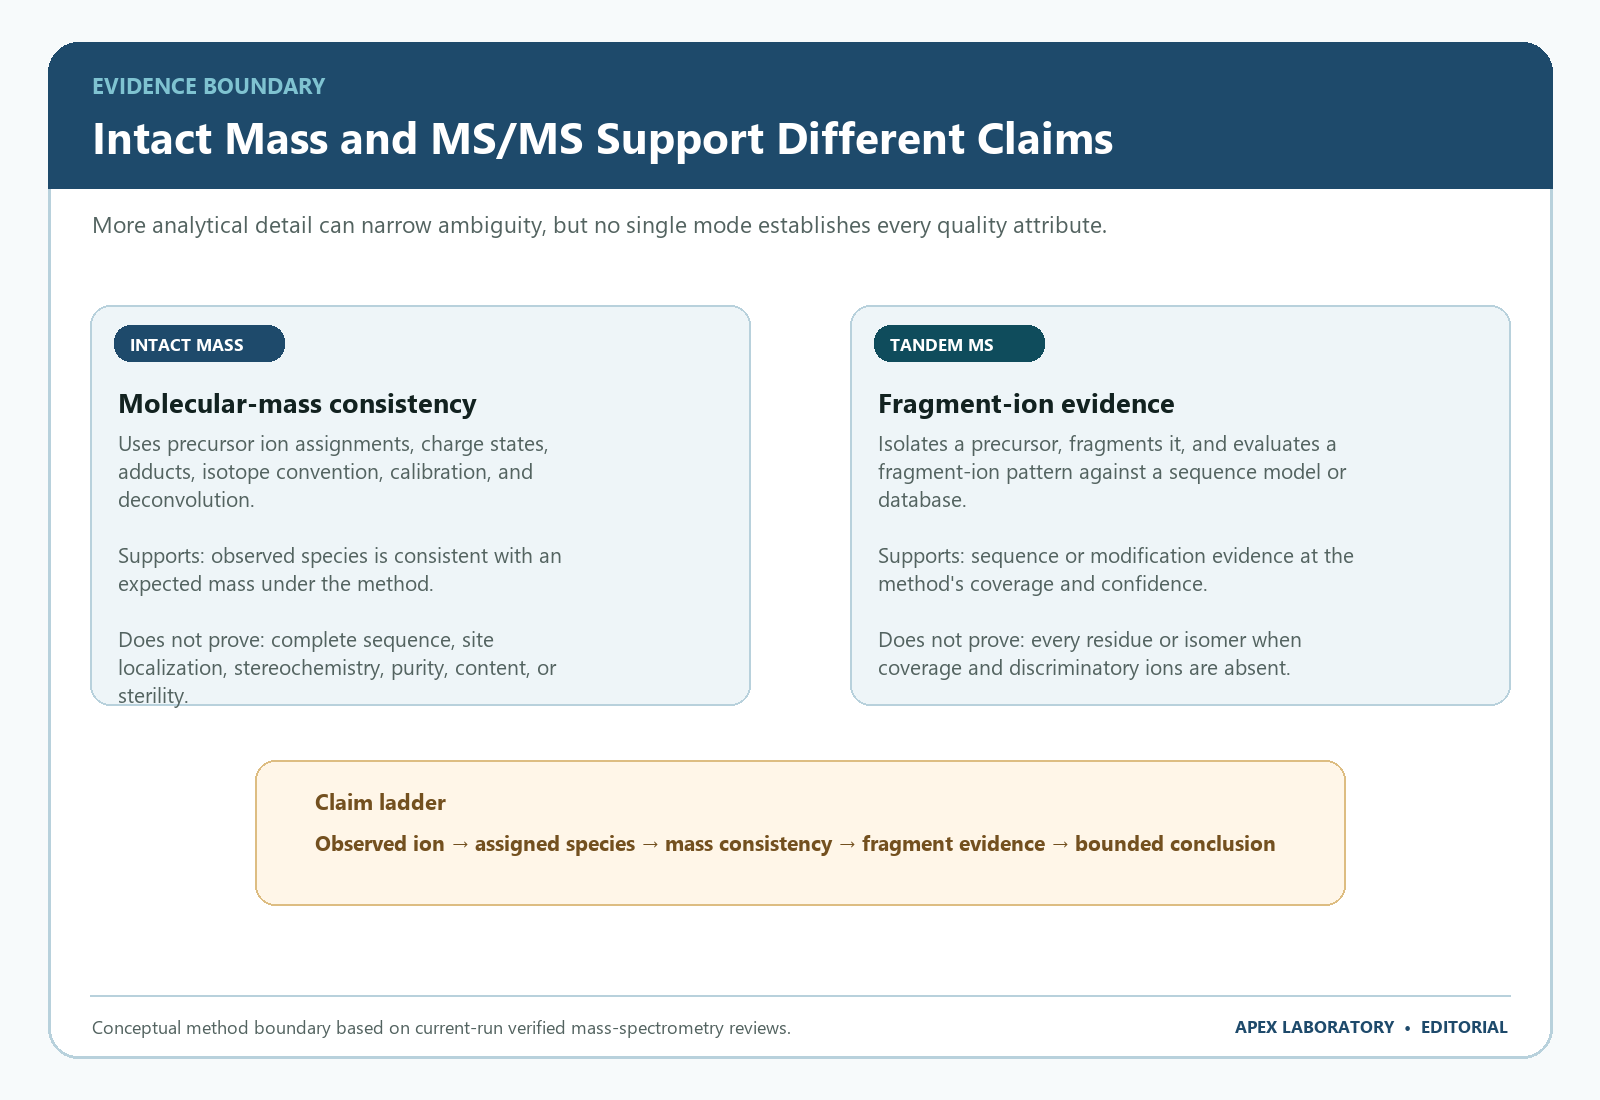
An intact-mass measurement can show that assigned ions or a deconvolved result are consistent with an expected molecular mass within the method’s criterion. This can identify large discrepancies and some mass-shifted species. It cannot, by itself, establish that residues occur in the intended order, locate a modification, distinguish every isomer, or prove that one mass-compatible sequence is the only explanation.
What MS/MS adds
Tandem mass spectrometry isolates a precursor and fragments it. The fragment-ion pattern is compared with a sequence model, searched against a database, or interpreted de novo. The result can provide sequence and modification evidence at the observed coverage and confidence. Steen and Mann and Domon and Aebersold describe the relationship between precursor selection, fragment-ion series, and peptide identification.35
Database-search scores are method outputs, not universal truth labels. Search space, mass tolerances, enzyme assumptions, variable modifications, false-discovery controls, spectrum quality, and scoring model affect identification. The Mascot probability-based approach described by Perkins and colleagues is an important historical example of how observed data are evaluated against sequence candidates.7 It defines a scoring model and reports no single quantitative endpoint transferable to an acceptance criterion.
How to read a peptide MS result without overclaiming
Use the following sequence before accepting a statement such as “mass confirmed”:
- Match the sample. Confirm lot, sample ID, material form, preparation, report, raw-data identifier, and run date.
- Define the expected species. Record sequence, termini, disulfides, modifications, counterion assumptions, and whether the expected value is monoisotopic or average mass.
- Name the method. Identify ionization route, analyzer, acquisition mode, calibration, processing software and version, and any LC separation.
- Assign the ion. State charge, isotope peak, adduct or neutral loss, and whether the reported number is an observed m/z or deconvolved neutral mass.
- Compare under a predefined rule. Show expected value, observed value, difference in appropriate units, and the validated acceptance criterion.
- State the evidence level. Distinguish intact-mass consistency from fragment-supported sequence evidence.
- State exclusions. List what the method does not establish, including purity percentage, content, stereochemistry, sterility, or experimental suitability when applicable.
A certificate can summarize this information, but the summary is strongest when it remains traceable to the controlled method and underlying data. The Apex Lab Verified hub is the current first-party batch-document destination; match any report to the exact lot and do not treat publication of a document as independent authentication of the sample or result.
An analytical result is not a regulatory status. Research-grade peptide reagents carry no FDA, EMA, NMPA, MHRA, PMDA, TGA or Health Canada approval for human or veterinary use, and no MS report changes that. Where the same molecule also exists as an approved drug product—semaglutide as Ozempic and Wegovy, for example—that authorization belongs to the finished pharmaceutical formulation and its manufacturer, not to the research-grade reagent of the same molecule.
Why HPLC and MS are complementary—not interchangeable
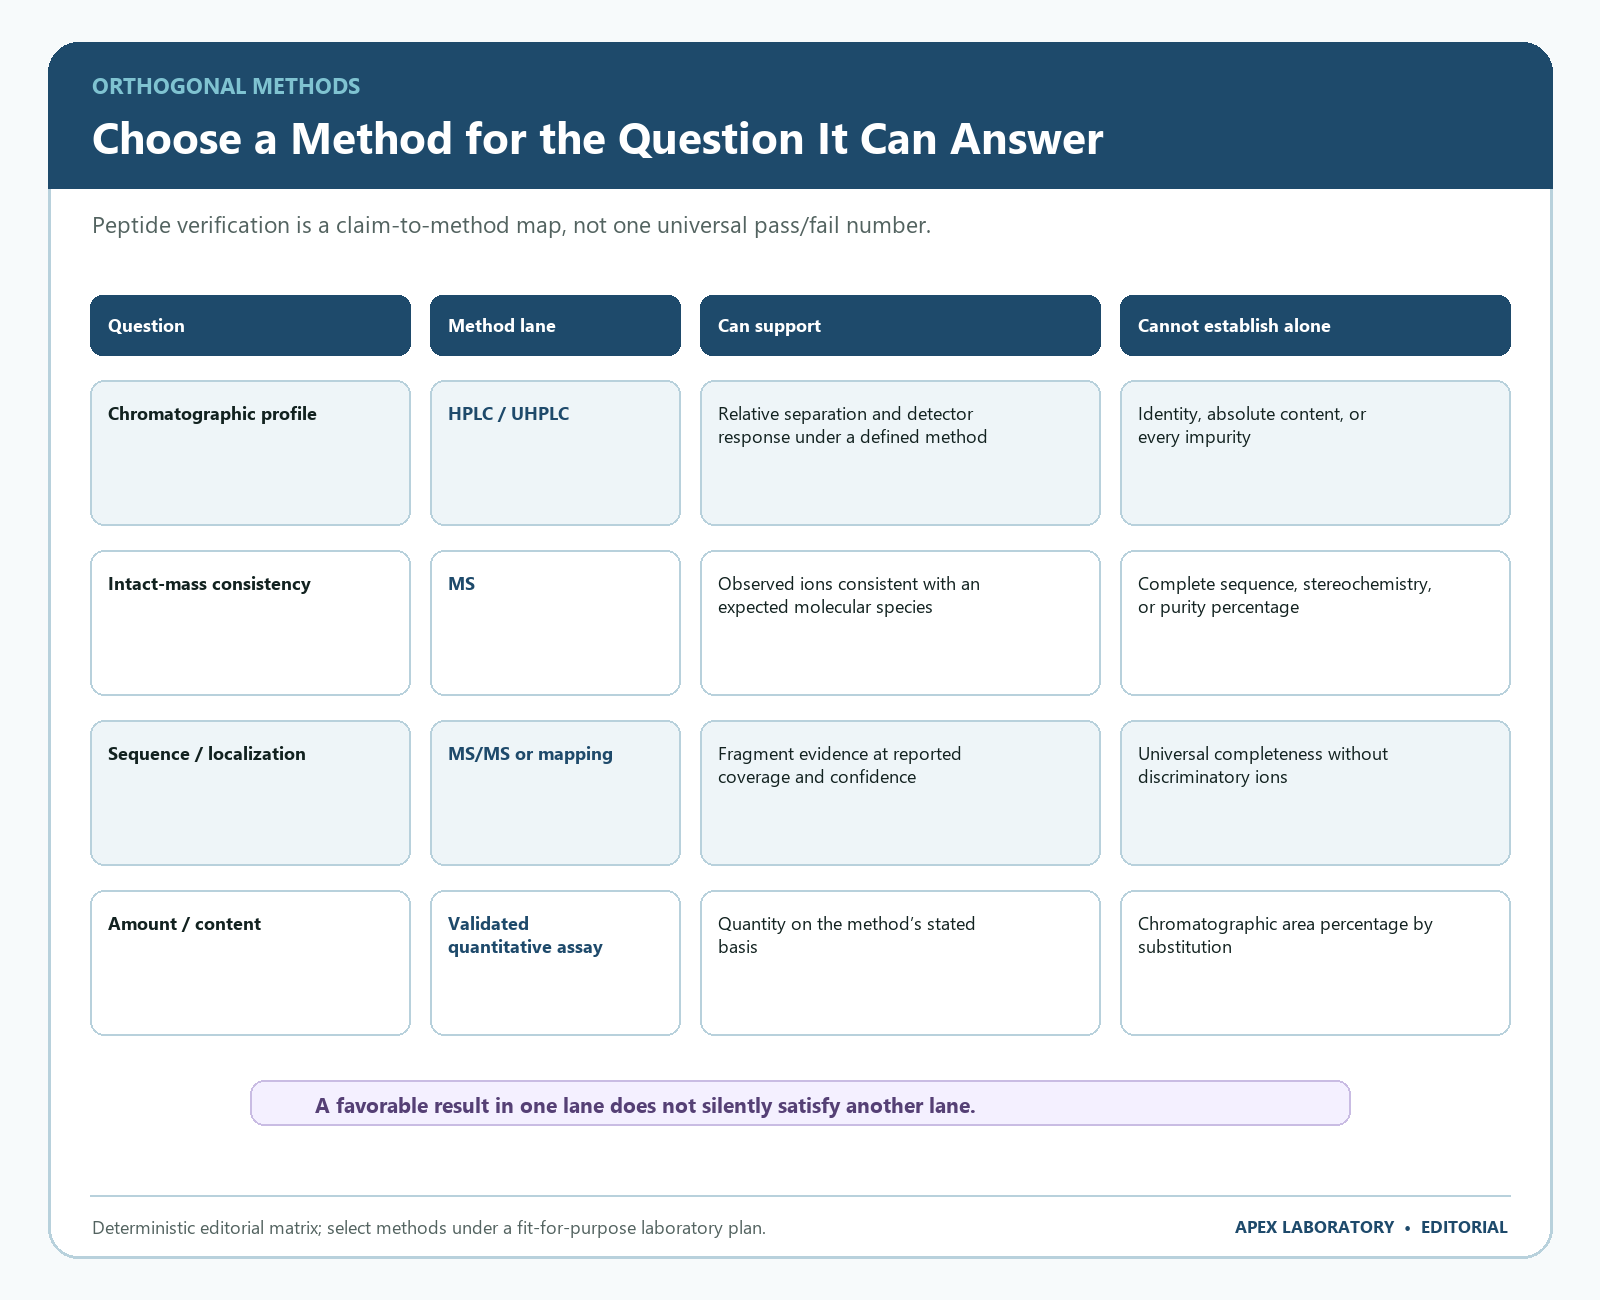
HPLC separates detected components under a chromatographic method and often reports relative peak area. Intact MS evaluates molecular-mass consistency. MS/MS adds fragment evidence. A validated quantitative assay addresses amount or content on its stated basis. These are different claims.
For chromatographic context, see How HPLC Peptide Purity Testing Works and What a 99% Peptide Purity Claim Means. The important boundary is simple: a dominant HPLC peak does not establish molecular identity, while a mass-compatible ion does not establish chromatographic purity or absolute content.
| Claim | Potential evidence lane | Essential context | Common overreach |
|---|---|---|---|
| Chromatographic profile | HPLC or UHPLC | Column, mobile phase, gradient, detector, integration, system suitability | Calling area percentage absolute content or identity |
| Intact-mass consistency | MS | Ionization, charge/adduct assignment, calibration, expected species, tolerance | Calling one mass value complete sequence confirmation |
| Sequence or modification evidence | MS/MS or peptide mapping | Precursor, fragmentation, coverage, discriminatory ions, search controls | Ignoring unobserved regions or isomer ambiguity |
| Amount or content | Validated quantitative method | Reference standard, calibration model, recovery, basis, uncertainty | Substituting HPLC area or raw MS intensity |
| Microbiological attribute | Purpose-specific microbiological method | Sampling, interference controls, validation, defined specification | Inferring sterility from chemical identity or purity |
Common peptide mass-spectrometry failure modes
- Wrong expected mass. The calculation omits terminal chemistry, disulfides, modification state, counterion assumptions, or isotope convention.
- m/z compared with neutral mass. A charged ion is compared directly with a neutral theoretical value.
- Adduct assigned as parent. Sodium, potassium, solvent, or matrix-related species are not considered.
- Unreviewed deconvolution. Software combines charge states into a neutral-mass result without sufficient signal or a documented model.
- Calibration or lock-mass drift. A precise-looking number is reported without showing calibration status or quality controls.
- Co-isolated species. A mixed precursor window creates a fragment pattern that is harder to assign.
- Response treated as concentration. Peak intensity is converted into composition without validated response factors and quantitation.
- Insufficient fragment coverage. Sequence or site-localization language exceeds the observed discriminatory evidence.
- Stereochemistry ignored. Enantiomers share mass; isomer discrimination requires suitable orthogonal methods.
- Detached evidence. The spectrum cannot be linked to the lot, sample, raw file, method, analyst, or report revision.
These are reasons to pause, clarify, or retest—not permission to guess. Preserve the original file, document the source and access date, and ask a question tied to the missing evidence. The peptide vendor evaluation guide places analytical documents inside a broader supplier and batch review.
A minimum reporting checklist
A useful peptide MS record should include enough information for a qualified reviewer to reconstruct the conclusion:
- material name, sequence or unambiguous identity, lot, sample ID, and submitted form;
- sample preparation and any LC separation or fraction selection;
- ionization method, polarity, analyzer, acquisition mode, and instrument identifier;
- calibration approach, quality-control status, and acquisition date;
- expected chemical species, mass convention, charge and adduct model;
- observed m/z values, assigned charge states, and deconvolved mass when used;
- software, version, processing settings, and manual-review status;
- predefined acceptance criterion and observed difference;
- MS/MS coverage, fragment evidence, search space, and confidence controls when sequence claims are made;
- raw-data identifier, report revision, analyst, reviewer, and limitations.
Verified scientific sources
- Mann M, et al. Analysis of proteins and proteomes by mass spectrometry. Annu Rev Biochem. 2001;70:437-73. PMID: PMID 11395414.
- Aebersold R, et al. Mass spectrometry-based proteomics. Nature. 2003;422(6928):198-207. PMID: PMID 12634793.
- Steen H, et al. The ABC’s (and XYZ’s) of peptide sequencing. Nat Rev Mol Cell Biol. 2004;5(9):699-711. PMID: PMID 15340378.
- Aebersold R, et al. Mass-spectrometric exploration of proteome structure and function. Nature. 2016;537(7620):347-55. PMID: PMID 27629641.
- Domon B, et al. Mass spectrometry and protein analysis. Science. 2006;312(5771):212-7. PMID: PMID 16614208.
- Hardman M, et al. Interfacing the orbitrap mass analyzer to an electrospray ion source. Anal Chem. 2003;75(7):1699-705. PMID: PMID 12705605.
- Perkins DN, et al. Probability-based protein identification by searching sequence databases using mass spectrometry data. Electrophoresis. 1999;20(18):3551-67. PMID: PMID 10612281.