
A “99% purity” result usually means that the main peak represented about 99% of integrated signal in a chromatographic method. It does not, by itself, prove peptide identity, total mass purity, biological activity, sterility, or absence of every contaminant. A defensible material assessment pairs method-qualified purity with orthogonal identity evidence, lot traceability, and enough procedural detail to interpret the result.
Purity percentages are useful only when the analytical question is stated correctly. In peptide research, “99%” often refers to reversed-phase high-performance liquid chromatography with ultraviolet detection (RP-HPLC-UV). The number can summarize one separation under one set of conditions. It cannot carry every conclusion that vendors, researchers, or procurement teams sometimes attach to it.
- HPLC area percent is a method-dependent signal ratio, not a universal mass-balance measurement.
- A large main peak does not establish that the peak contains the expected peptide.
- Co-elution, detector response, wavelength, integration, sample preparation, and reporting thresholds can change the result.
- Water, counterions, residual solvents, and non-detected material may sit outside an HPLC-UV area-percent claim.
- Mass spectrometry can support molecular identity, but it does not turn a chromatogram into proof of every quality attribute.
- A useful certificate of analysis links the result to the exact lot and states the method, result, identity evidence, and laboratory context.
What Does “99% Purity” Usually Mean?
In a typical peptide COA, the reported value is chromatographic area percent. The laboratory injects a prepared sample, separates components on a column, detects signal over time, integrates selected peaks, and calculates the main peak’s area as a percentage of the included peak areas. If the main peak is 99 units of an integrated total of 100, the report may state 99% HPLC purity.
That statement is narrower than “99% of everything in the vial is the intended peptide by mass.” The calculation concerns detected and integrated signal under the stated procedure. The ICH Q2(R2) validation guideline published by FDA requires an analytical procedure to be fit for its intended purpose, while ICH Q6A cautions that a single chromatographic retention time is not sufficiently specific for identity. Together, those in-scope principles support a bounded reading of area percent; they do not turn it into total mass balance or identity proof.
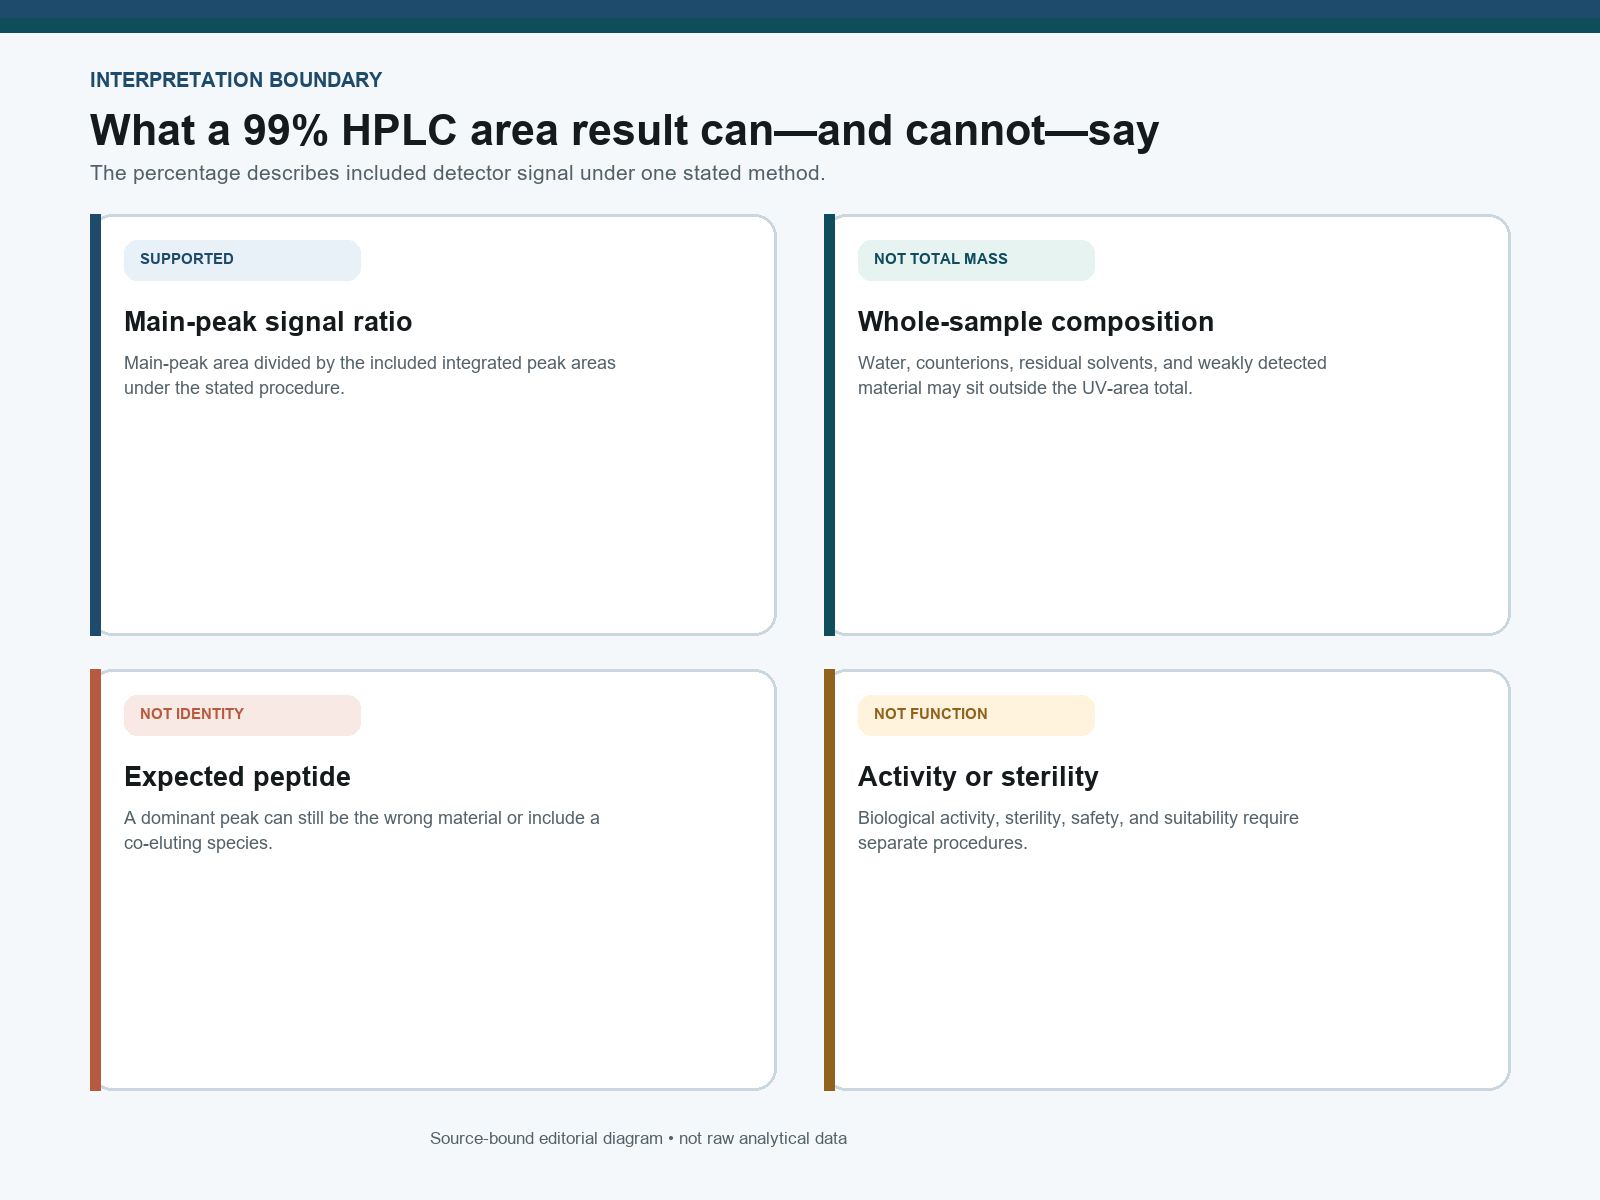
Area Percent Is Not the Same as Total Composition
An HPLC-UV detector does not weigh every constituent equally. Detector response depends on the compound, wavelength, concentration range, and other method conditions. Two species present at the same mass can produce different signal areas. A component that does not absorb well at the selected wavelength may be underrepresented, while another may respond strongly.
Several material classes can fall outside the intuitive “main peak plus impurities” picture:
| Material or effect | What HPLC-UV area percent may show | What still needs context or another method |
|---|---|---|
| Sequence-related variants | May resolve as separate peaks if the method separates them | Co-elution or low response can obscure distinction |
| Deletion, truncation, or modification products | May produce additional peaks | Identity of each peak is not established by retention time alone |
| Water and volatile material | Often not represented in the UV peak-area total | Requires suitable water or residual-solvent testing |
| Counterions and inorganic salts | May have little or no signal in the selected UV method | Requires methods suited to the counterion or elemental/inorganic question |
| Co-eluting species | Can contribute to the apparent main-peak area | Needs improved separation or orthogonal characterization |
This is why a purity figure should be read as “reported under this method,” not as an all-purpose certificate. Reversed-phase HPLC has long been central to peptide separation and characterization, but its evidentiary value comes from the procedure and interpretation, not the presence of a chromatogram alone. The 1981 radial-compression report that helped establish the technique specified its conditions rather than a percentage: a C18 microparticulate support in a polyethylene cartridge under about 2,600 p.s.i. of radial compression, eluted with a 1% aqueous triethylammonium phosphate mobile phase at pH 3.2 modified with acetonitrile or isopropanol, resolving in-vitro mixtures such as human very-low-density-lipoprotein apolipoproteins and murine tryptic fragments.[1]
Why HPLC Method Details Change the Meaning
A result is interpretable when the record supplies enough information to understand how it was produced. At minimum, the method context should identify the column or stationary-phase class, mobile phases, gradient or elution program, flow, detector and wavelength, sample preparation, injection conditions, run time, integration rules, and reporting threshold. Suitability checks and representative system performance strengthen the record.
Method specificity is especially important. A main peak can look clean because the procedure genuinely separates related species—or because the conditions fail to separate them. The FDA-hosted ICH Q2(R2) framework requires analytical validation characteristics to fit the intended use. When one procedure lacks enough specificity, supporting procedures may compensate. ICH Q6A also cautions that identity based on a single chromatographic retention time is not sufficiently specific.
Integration and threshold choices
Peak integration converts a continuous detector trace into discrete areas. Baseline placement, shoulder handling, noise rejection, minimum-area thresholds, and manual edits can materially affect the reported total. A laboratory should document its rules and retain the underlying data. “Ignore every peak below 1%” and “quantify all detectable related species” are not equivalent approaches.
Peptide-specific analytical challenges
Solid-phase peptide synthesis can yield deletion sequences, incomplete deprotection products, oxidation, deamidation, aggregation, or other process- and stability-related variants. The exact risk depends on sequence and process: in the published Fmoc/tBu protocol, the 41-residue corticotropin-releasing factor peptide takes roughly 80 hours of working time, and chain aggregation during elongation is named as the main cause of failed chemosynthesis for difficult sequences.[2] Deamidation and other changes can be condition-dependent, so sample handling and stability also matter; experimentally verified predictive calculations covering 1,371 asparaginyl residues across 126 human proteins indicate deamidation is a biologically relevant process in a large share of them, not a rare edge case.[3] No single generic purity number resolves every sequence-specific problem.
Why Purity Does Not Prove Identity
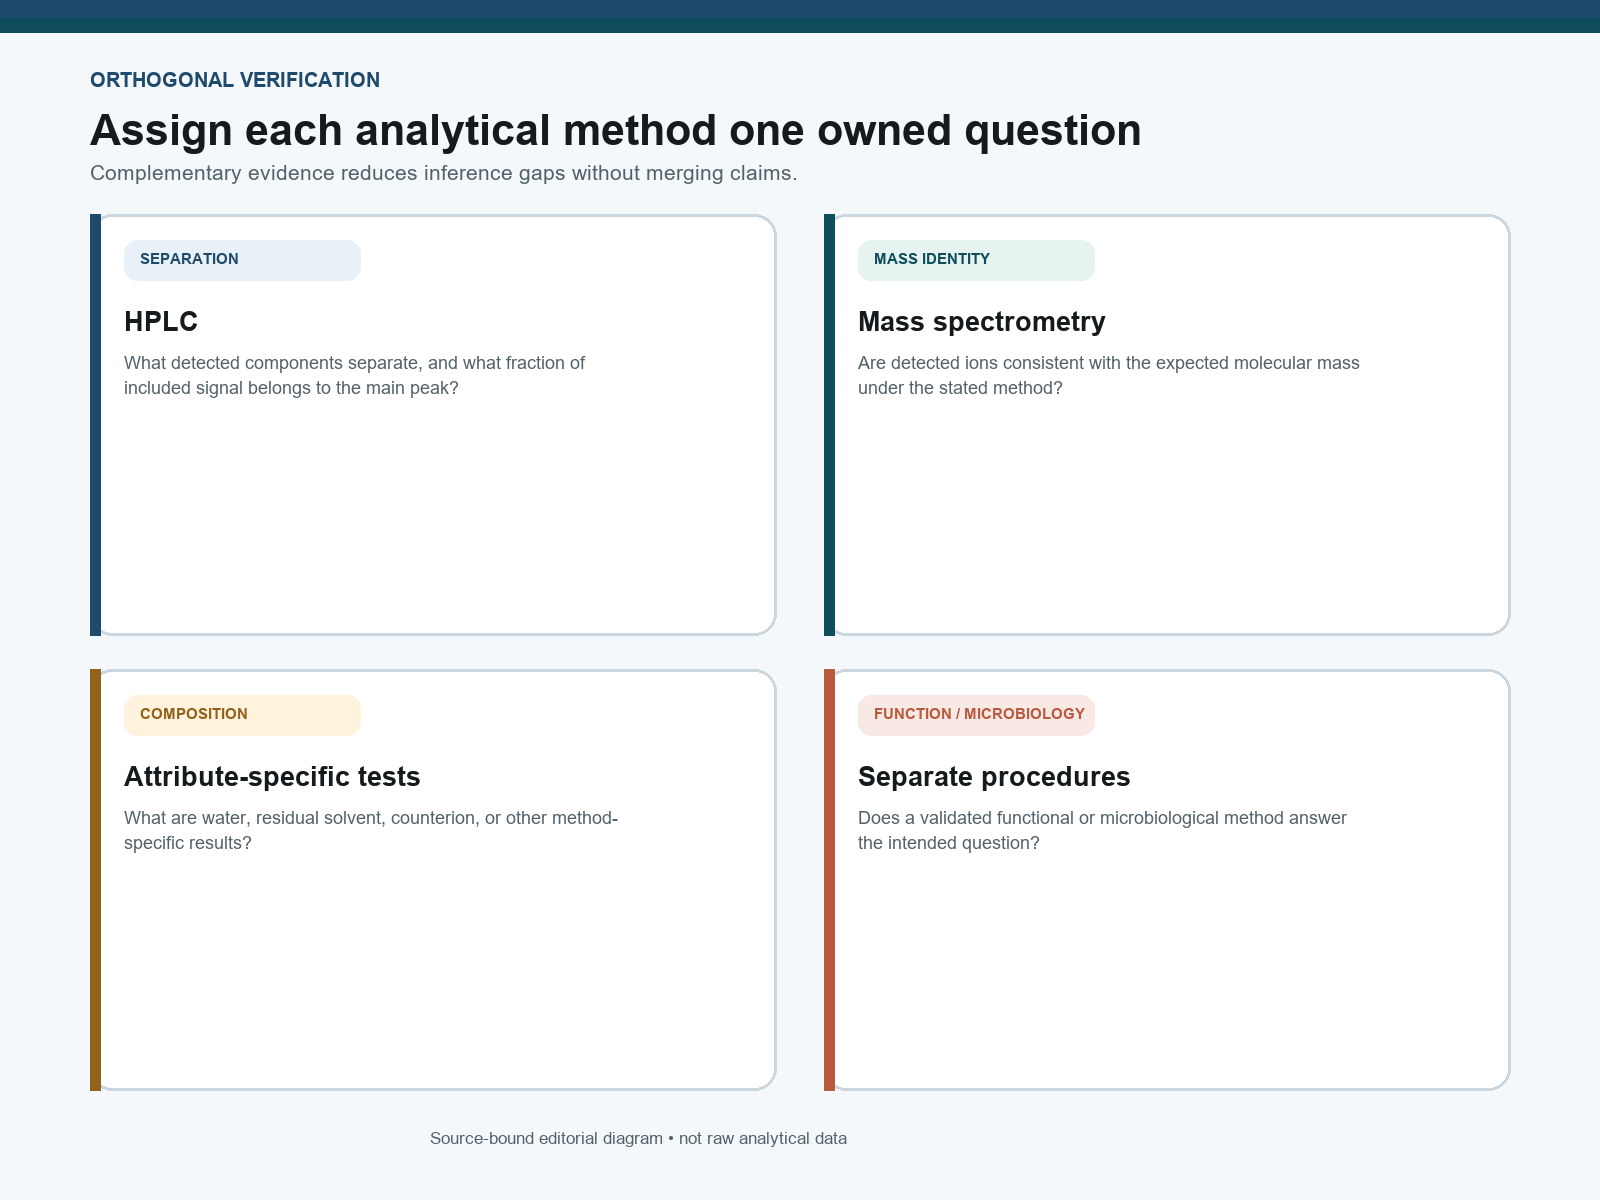
HPLC answers a separation question. Identity asks whether the material is the expected chemical entity. A pure wrong compound can produce one dominant chromatographic peak. Retention-time comparison can add support when a suitable reference and method are used, but retention time alone is not a sufficiently specific identity test.
Mass spectrometry provides orthogonal evidence by testing whether detected ions are consistent with the expected molecular mass. Depending on the instrument and method, it may also reveal some truncations, adducts, modifications, or heterogeneous species. Yet a mass spectrum has its own scope: it does not automatically quantify every component, demonstrate sequence order in every case, establish biological activity, or prove sterility.
What Is in the Remaining 1%?
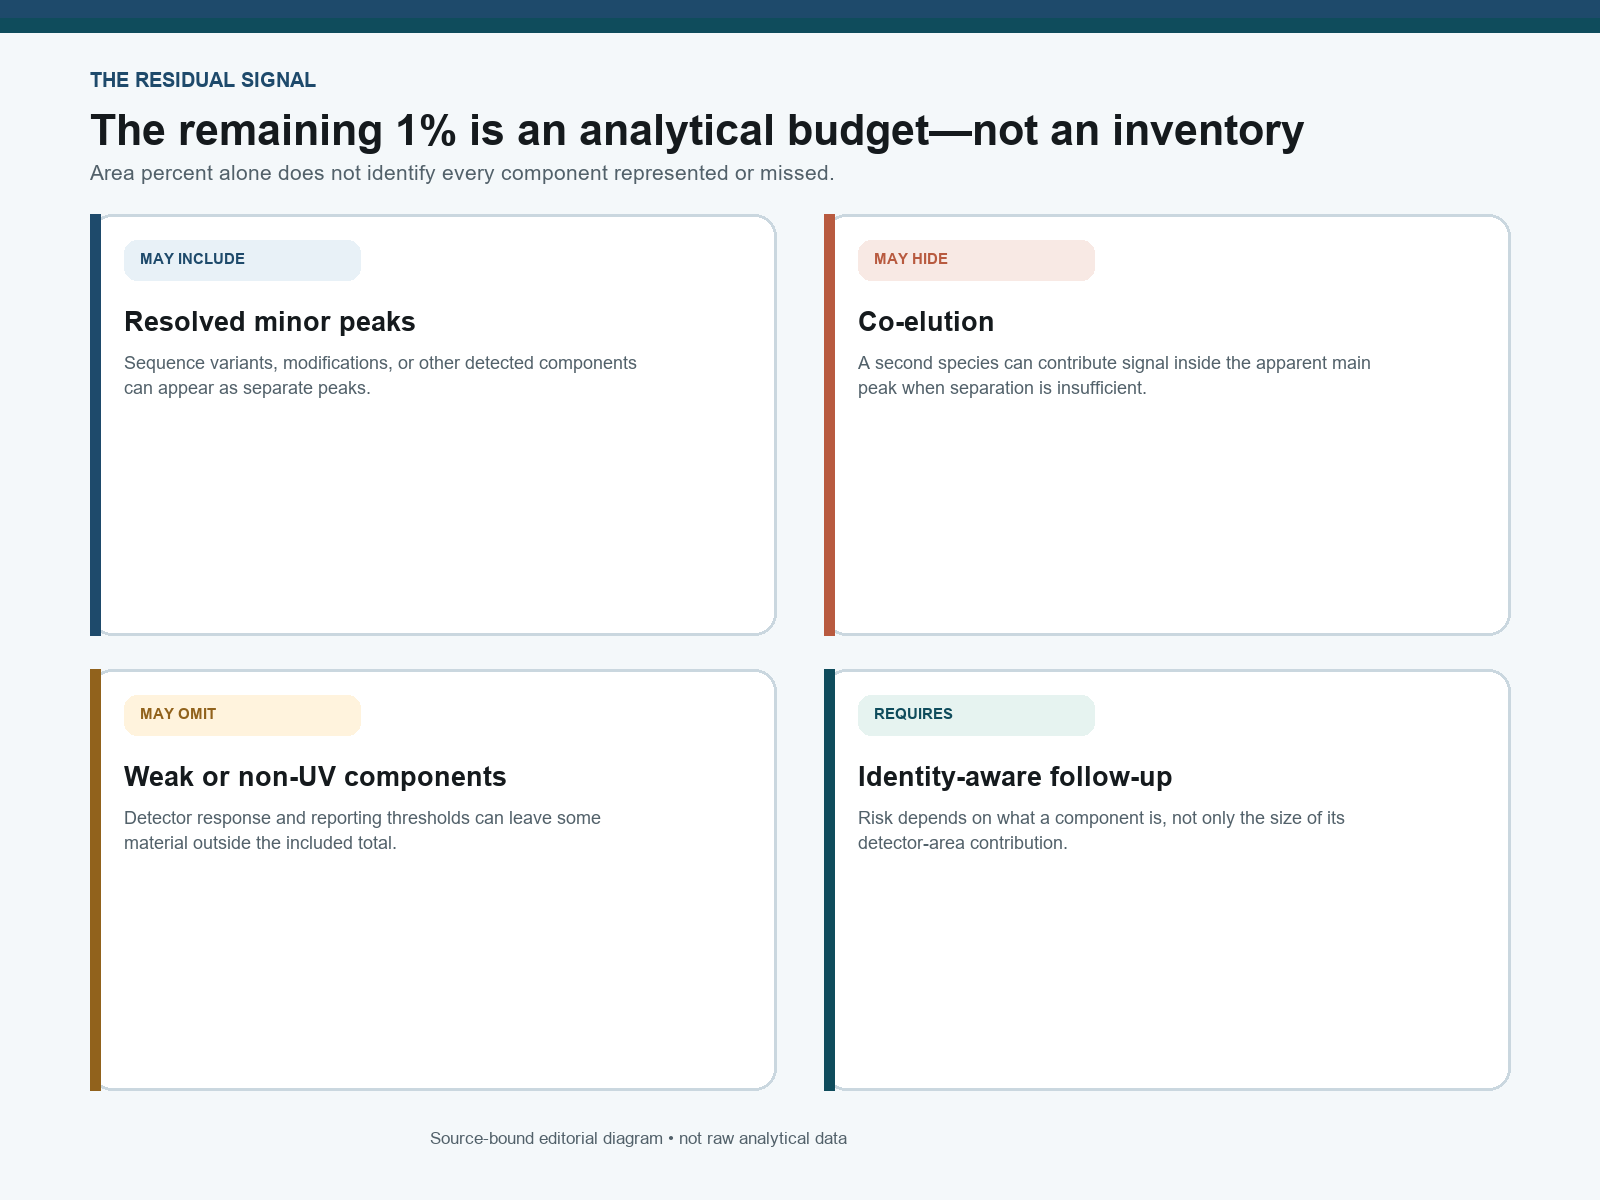
The honest answer is often: the area-percent calculation alone does not identify it. The “other 1%” is an analytical budget of included non-main-peak signal. It may contain several resolved species, integration artifacts, or unknowns. It is not necessarily a single impurity, and it is not necessarily the complete set of non-peptide material in the sample.
Risk depends on identity and context, not only quantity. A small amount of one sequence-related impurity may raise a different question from the same area of another species. Synthetic peptide impurities can matter because immune recognition and other biological consequences are structure-dependent; this does not mean every low-level peak is hazardous, but it does mean “only 1%” is not a complete risk analysis.[4]
Additional reported findings
Three sources that supported earlier versions of this page describe where residual species come from. Their readouts are recorded here as a claim map rather than restated in prose, so each figure stays attached to the study that reported it.
| Source and scope | Model or material | Reported readout | Source |
|---|---|---|---|
| Robinson & Robinson 2008 — Merrifield solid-phase synthesis as the tool of deamidation research | Synthetic peptides and proteins, in-vitro | More than 900 peptides synthesized in Merrifield’s laboratory across roughly 40 years of deamidation work; structure-determined deamidation half-times vary over a wide range under biological conditions, and asparaginyl rates became predictable from three-dimensional structure | PMID 17896348 |
| Manning, Patel & Borchardt 1989 — decomposition-pathway taxonomy | Protein pharmaceuticals, narrative review | Catalogues proteolysis, deamidation, oxidation, racemization and beta-elimination alongside aggregation, precipitation, denaturation and surface adsorption; the review reports no quantitative endpoint, so no effect size is transferred here | PMID 2687836 |
| Isidro-Llobet et al. 2019 — manufacturing-scale synthesis and purification, ACS GCI Pharmaceutical Roundtable | Peptide API process chemistry, narrative review | Scope figures only: more than 50 marketed peptide drugs, approximately 170 in clinical trials and more than 200 in preclinical development; the review reports no quantitative endpoint for impurity content | PMID 30900880 |
A Better Checklist for Reviewing a Peptide COA
A useful COA is lot-specific and traceable. It should let a reviewer connect the named material and lot to the reported procedure and result. The certificate does not need to reproduce every page of raw data, but it should provide enough context to support a documented assessment and a path to underlying records when appropriate.
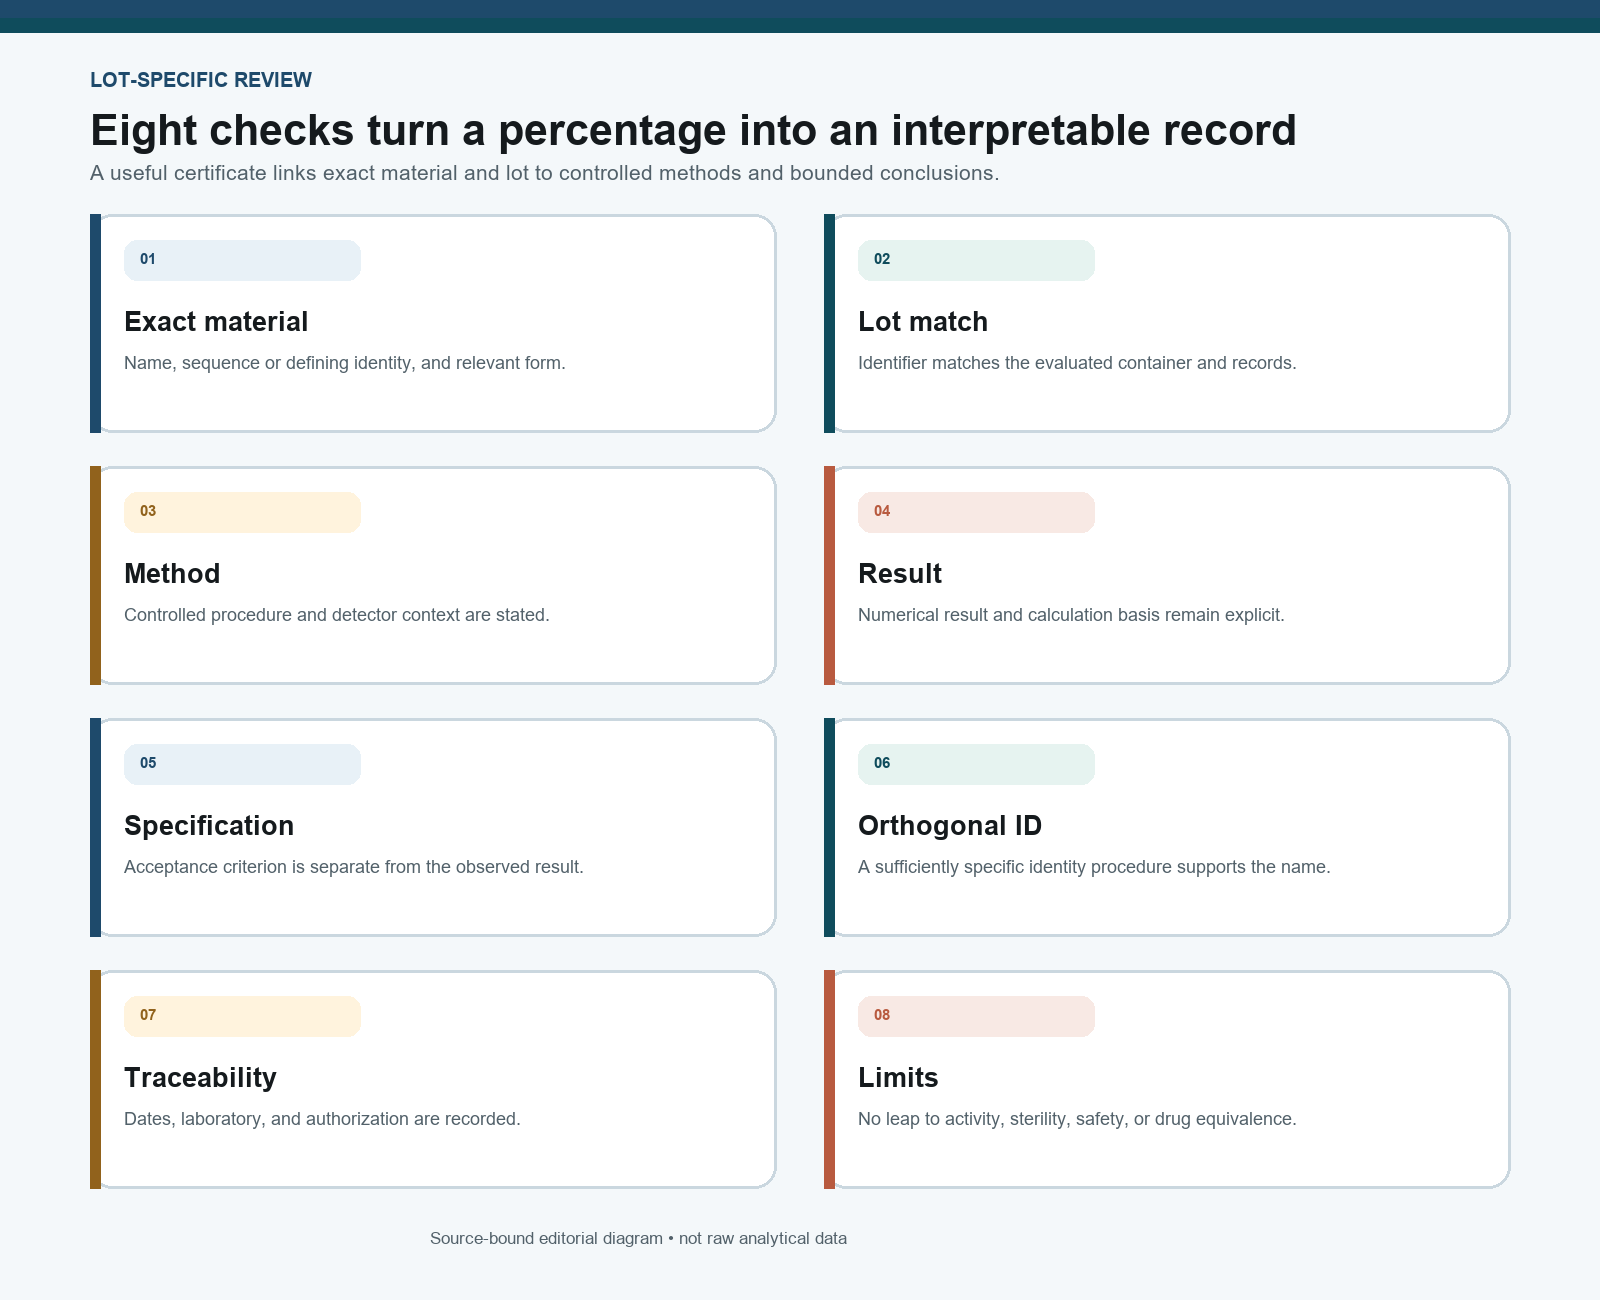
- Material identity: exact name and, where relevant, sequence, salt or counterion form, and other defining attributes.
- Lot link: a lot or batch identifier that matches the evaluated container and associated records.
- Method identification: the analytical procedure or a controlled method reference, including detector context.
- Result and specification: the numerical result, units or calculation basis, and acceptance criterion kept distinct.
- Orthogonal identity evidence: mass or another fit-for-purpose identity procedure rather than HPLC alone.
- Dates and laboratory: test date, report date, and the laboratory or responsible organization.
- Authorization: a controlled approval or other indication that the report is final.
- Limits: no unsupported leap from analytical attributes to sterility, activity, safety, efficacy, or regulatory equivalence.
For deeper method interpretation, use the dedicated HPLC peptide-purity guide, mass-spectrometry guide, and COA reading guide. The vendor-evaluation checklist shows how those records fit into a procurement decision, while research grade vs pharmaceutical grade separates analytical data from finished-drug quality systems.
Common Purity Claims That Overreach
| Claim | Why it fails | Better wording |
|---|---|---|
| “99% pure means 99% of the vial is peptide.” | Area percent is not automatically total mass fraction. | “The main peak was reported as 99% of included chromatographic area under the stated method.” |
| “One peak proves identity.” | A pure wrong material can also produce one dominant peak. | “Chromatographic purity and orthogonal identity evidence were reviewed separately.” |
| “The remaining 1% is harmless.” | The percentage does not identify the residual components or establish risk. | “Non-main-peak signal requires method- and identity-aware interpretation.” |
| “HPLC and MS prove biological activity.” | Analytical identity and purity do not substitute for a validated functional assay. | “HPLC and MS support bounded analytical attributes; activity is a separate question.” |
| “A COA proves pharmaceutical quality.” | A certificate is one record, not a manufacturing, regulatory, or finished-product system. | “The COA reports lot-specific results within its stated scope.” |
Purity grade is an analytical attribute, not a regulatory status. A research-grade peptide reagent holds no FDA, EMA, NMPA, MHRA, or other regulatory approval anywhere globally, whatever percentage its certificate reports. Pharmaceutical-grade active ingredients sit in a separate category defined by cGMP manufacturing and per-jurisdiction marketing authorization — a licensing and quality-system framework, not simply a higher number on a chromatogram.
Frequently Asked Questions
Does 99% HPLC purity mean 99% of all material by weight is the peptide?
No. It usually means the main peak represented about 99% of included detector signal under a specified chromatographic method. Total mass composition requires additional context and, where relevant, other tests.
Can HPLC alone prove peptide identity?
No. HPLC can support separation and retention behavior under a stated method, but identity needs a sufficiently specific procedure, commonly including orthogonal mass evidence.
Does a 99% result identify what is in the remaining 1%?
No. The residual percentage represents included non-main-peak signal. Identifying its components requires suitable separation, characterization, thresholds, and method context.
Do HPLC and mass spectrometry prove biological activity or sterility?
No. They can support bounded purity and identity conclusions. Biological activity, sterility, endotoxin, water, residual solvents, and other attributes require their own fit-for-purpose procedures.
What should a reviewer look for on a peptide COA?
Look for exact material and lot identity, method references, result and specification, orthogonal identity evidence, dates, laboratory attribution, authorization, and clear limits on what the certificate establishes.
References
- Hancock WS, et al. The use of reversed-phase high-performance liquid chromatography with radial compression for the analysis of peptide and protein mixtures. J Chromatogr. 1981;206(1):59-70. PMID: PMID 7217281.
- Coin I, et al. Solid-phase peptide synthesis: from standard procedures to the synthesis of difficult sequences. Nat Protoc. 2007;2(12):3247-56. PMID: PMID 18079725.
- Robinson NE, et al. Deamidation of human proteins. Proc Natl Acad Sci U S A. 2001;98(22):12409-13. PMID: PMID 11606750.
- De Groot AS, et al. Immunogenicity risk assessment of synthetic peptide drugs and their impurities. Drug Discov Today. 2023;28(10):103714. PMID: PMID 37467878.